To ensure excellent execution, splitting your project into phases and listing the activities that need to be done at the initiative's beginning, middle, and end can work wonders. But how is it possible to monitor these phases? How can you know when each stage starts? Mapping the steps of the project can be the answer.
Throughout the mapping, it is possible to realize:
- How many tasks the team needs to execute
- The number of people that should get involved
- What resources are necessary for the execution
- And how much time the team needs to reach the expected results
Visualizing these aspects can increase the work's efficiency and enable you to identify and manage possible blockers and improve the team's performance.
Now that we know what project mapping is and why it can add more value to a project, let’s dig deeper into how it is possible to turn that plan into reality.
How to map a project's steps
The main goal should be the starting point: what project do you need to map? When it is clear enough, it’s time to move on to the following steps:
Define what the project phases are
Almost every initiative has its beginning, middle, and end. Once there is more clarity about the tasks that need to be executed, it is possible to move on, considering what needs to be done and when it needs to be done.
Create a diagram, flowchart, or any other visualization method
When mapping a project, one of the most important things is how you structure and visualize it. Using visual tools, such as a flowchart, makes it possible to optimize planning, identify dependencies and risks, name the team members responsible for tasks, and clarify the deadlines for execution. This also makes the documentation process faster and more fluid.
Find possible areas for process optimization
This is a good moment to share the initiative with the rest of the team—giving visibility into the project stages and listening to feedback about issues, deadlines, or other possible obstacles that may arise.
There are several tools available to map projects, and one of them is the Gantt chart, which aims to make project mapping easier to nail down. Do you know this visualization method and its advantages? If not, let's introduce it to you!
What’s a Gantt chart?
Gantt charts are visual tools to map a project's roadmap. It can quickly show how much time each task needs, which helps your team meet deadlines and deal with possible issues that may arise throughout the process.
Gantt diagrams display a horizontal bar chart representing the project tasks, their dependency relationships, their duration, the team member responsible for the execution, and the estimated completion date. Vertically, it's possible to find columns that determine the time, divided into months, weeks, sprints, or whatever makes the most sense for the team.Have a look at an example:
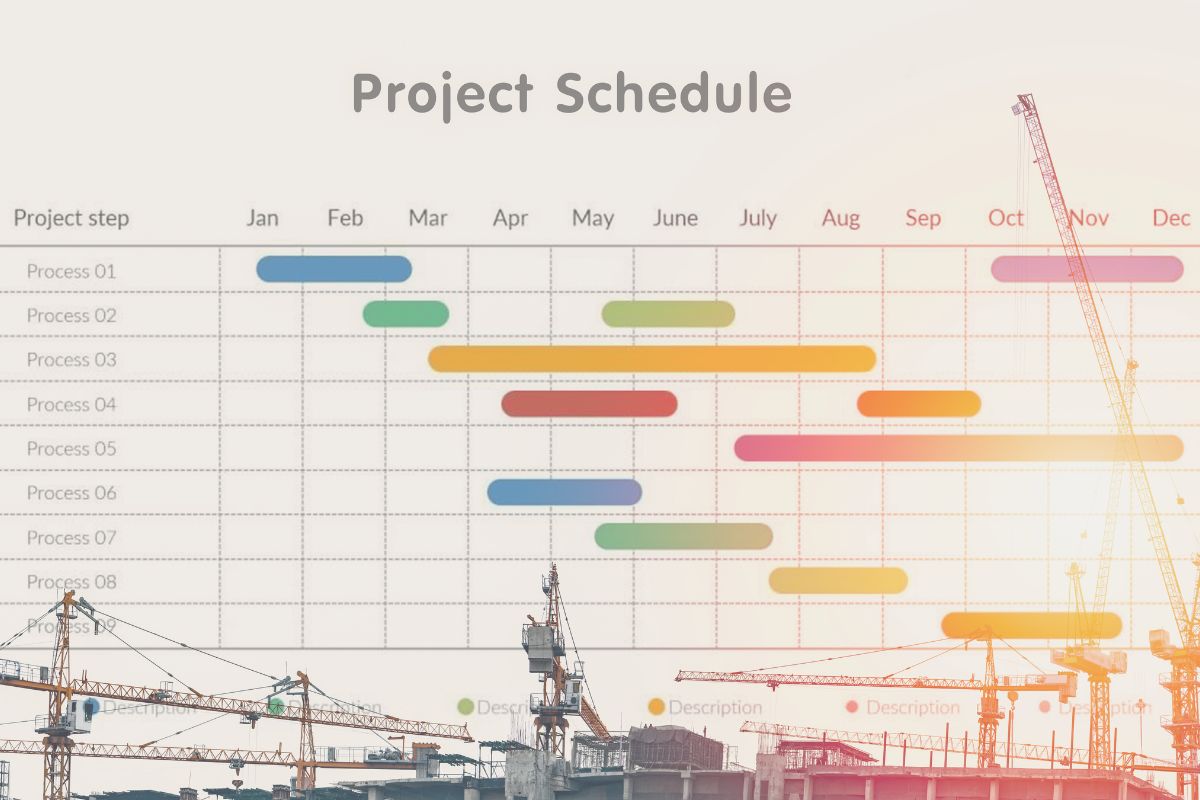
Besides facilitating project visualization, Gantt charts also help to break up large tasks into small ones, making their execution less complicated.
This detailed presentation makes it easier to keep stakeholders aware of what team members are doing and the expected time for completing tasks. For project managers, it's possible to create more effective project planning, share its status, and negotiate to increase or decrease the deadline if needed.
The golden tip: How mapping processes can help your projects
A project has a beginning and an end—it won't happen again. But the steps usually comprise our daily tasks, which can be more thoroughly mapped to support your projects.
With Qntrl, you can map all kinds of project tasks - it doesn't matter if you're hiring a new employee, developing software, or requesting a company trip.
With the process builder, it's possible to separate the project phases, regardless of the size, which makes the visualization more intuitive for the whole team and other people involved in the initiative. Check out other tips to make your work even more efficient:
- Automate tasks and make the process more agile
Depending on the project type, the roadmap can follow different paths. Some tasks might get blocked because they need other people's approval outside the team, for example. With process automation, it is possible to prevent this type of situation from being an obstacle in the workflow.
- Customize charts and graphs according to your project
Personalization is also a vital point in mapping tasks and processes. With Qntrl, you can customize charts and graphs based on your industry segment - marketing, HR, IT, sales, procurement, finance, customer support, and more. It's always good to create a visualization that makes sense for the activity and corresponds to the flow of the current project.
- Simplify tasks executed simultaneously
With the parallel transitions feature, it is possible to configure task transitions that need to be performed at the same time, ensuring that all of them can be done simultaneously. Once the transitions are done, the project will move on to the next step.
By mapping the regular tasks that are part of a project, your team's processes get more visible to company members and reach a new organizational level. Also, it's easier to identify alternative solutions in case of obstacles, which makes you closer to achieving your project's goals.
GUEST WRITER: Marina Meireles